|
Posted 11/14/23
SEE NO EVIL – HEAR NO EVIL – SPEAK NO EVIL
Is the violent crime “problem” really all in our heads?
For Police Issues by Julius (Jay) Wachtel. Cheekily entitled “This is Your Brain on Crime,” a recent op-ed essay by Nobel-prize winning economist and famous New York Times opinionizer Paul Krugman blasts self-serving politicos of the Red persuasion for promoting the fear that criminal violence is going up. Packed with charts and numbers, Dr. Krugman’s piece, which elaborates on his 2016 “Inequality and the City” essay, argues that except for a temporary, pandemic-related uptick, criminal violence has receded to historically low levels. Even better, his place of abode, New York City, “happens to have remarkably low crime, with a murder rate around half that of Republican-run cities like Miami and Fort Worth.”
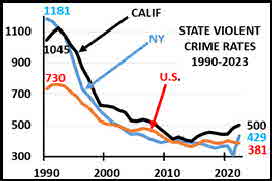
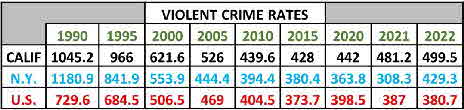
On its face, Dr. Krugman’s contention that the trend in violent crime (homicide, rape, aggravated assault and robbery) is highly favorable seems well supported by data. This graph, and its accompanying table, are based on the latest numbers from the FBI’s Crime Data Explorer.
On the opposite coast, veteran L.A. Times staff writer Libor Jany, who covers the police beat, mostly agrees. His recent article, “Crime is down, but fear is up: Why is L.A. still perceived as dangerous?” grouses that T.V. news remains fixated on “grisly murders and wild police chases” even though violent crime has substantially declined. But unlike his east-coast counterpart, Mr. Jany points out that the benefits haven’t been equally dispersed:
Click here for the complete collection of crime & punishment essays
Places that have historically had the highest rates of violent crime, including South L.A., Watts and the northeast San Fernando Valley, remain hot spots. Black residents in the city’s poorest neighborhoods suffer the majority of the bloodshed, with Black children and adolescents in Los Angeles County killed by firearms at triple the rate of their proportion of the population, according to data from the Department of Public Health’s Office of Violence Prevention.
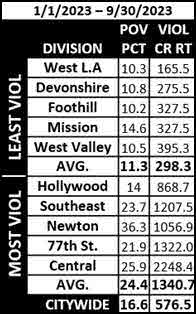 “Good News/Bad News” and “Policing Can’t Fix What Really Ails” recently addressed the burdens of economic deprivation in great detail. Check out the table on the left. According to present-year data (1/1 thru 9/30/23) LAPD’s five most violent divisions have violent crime rates nearly four and one-half times greater than their counterparts on the least violent end of the spectrum. What’s more, the violent divisions’ poverty rates are also more than twice as large. Compare their numbers to the preceding table. During the first nine months of 2023, four of the five high-violence divisions had violent crime rates that exceeded, several by substantial margins, the full-year rates that California, New York and the U.S. endured during the crack wars of the nineties. “Good News/Bad News” and “Policing Can’t Fix What Really Ails” recently addressed the burdens of economic deprivation in great detail. Check out the table on the left. According to present-year data (1/1 thru 9/30/23) LAPD’s five most violent divisions have violent crime rates nearly four and one-half times greater than their counterparts on the least violent end of the spectrum. What’s more, the violent divisions’ poverty rates are also more than twice as large. Compare their numbers to the preceding table. During the first nine months of 2023, four of the five high-violence divisions had violent crime rates that exceeded, several by substantial margins, the full-year rates that California, New York and the U.S. endured during the crack wars of the nineties.
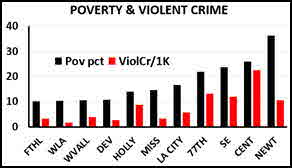
So what about New York City? Our past analyses – “Woke Up, America!”, “Place Matters”, and “Be Careful What You Brag About (II)” – reported that poverty and violence had a powerful connection in Gotham as well. Compare these graphs from “Be Careful”:
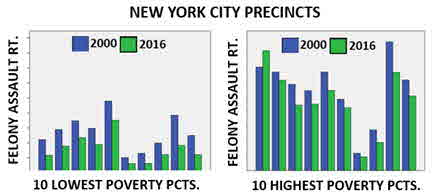
Their “Y” (vertical) axes range from zero to 900 felony assaults per 100,000 pop. Clearly, the burden of poverty seems indisputable.
Now comes Dr. Krugman. His essay inspired us to update New York City’s crime numbers, and in a way that leaves (we hope) no doubt as to whether his “one-city” vision really holds up. Using data from NYPD, the UCR, the FBI, the Census, and the City of New York, we collected violent crime numbers for 74 of New York City’s 77 police precincts for the years 2000, 2010, 2015, 2020, 2021 and 2022. We skipped over the 14th. precinct (now “Midtown South) because of its unique demographics (it’s home to office buildings, Times Square, Grand Central Terminal, Penn Station, Madison Square Garden and the Manhattan Mall). We also left out the “DOC” (Dept. of Corrections) precinct and the 121st. precinct, for which data was incomplete.
After calculating seventy-four precincts’ yearly violent crime rate (murders, felony assaults, rapes and robberies per 100,000 pop.), we identified the five precincts with the highest rates and the five precincts with the lowest rates each year. As it turns out, our “low” and “high” tables each wound up with eight precincts, but only the five “low” and five “high” yearly scores are displayed:
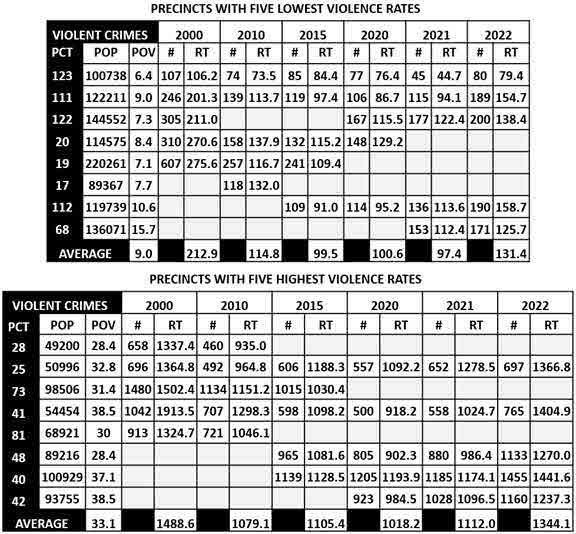
To clarify, # represents the actual number of violent crimes, and RT is the corresponding rate per 100,000 population. Mean rates (“AVERAGE”) were computed for two measures:
- Percent of residents in poverty across the eight districts in each table (2009-2013 est., with precinct boundaries based on comparisons between precinct and council district maps)
- Mean of the five lowest and five highest precinct violence rates each year
More than six-hundred thousand persons (605,977) reside in the eight precincts that made it into our high-violence table. Their mean yearly violent crime rates were seven to more than eleven times worse than the corresponding yearly means of their low-violence counterparts. And the overall percentage of residents living in poverty was 3.7 times greater in the high-violence precincts . Once again, the poverty/violent crime connection seems indisputable.
How does that fit historical trends? Here are New York City and New York state rates since 1990:
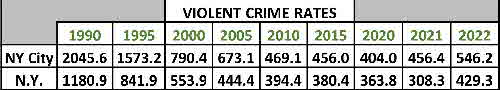
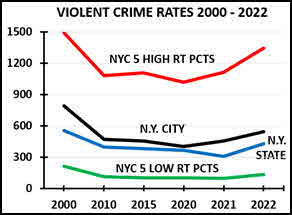 We couldn’t find reliable New York City precinct stat’s that precede 2000. But since then, the yearly violent crime rates of high-violence precincts have consistently exceeded – usually, by a substantial margin – the corresponding rates of both New York City and New York state. In 2000, as the U.S. was recovering from the crack epidemic of the nineties, our high-rate precincts’ mean violent crime rate (1488.6) was nearly twice the city’s 790.4 and 2.7 times worse than the state’s 553.9. (In fact, the 41st. precinct’s sky-high 2000 rate of 1913.5 was far worse than the state’s 1990 rate and nearly equaled the city’s). By 2022, our high-violence precincts’ mean rates were 2.5 times worse than the city’s and 3.1 times worse than the state’s. We couldn’t find reliable New York City precinct stat’s that precede 2000. But since then, the yearly violent crime rates of high-violence precincts have consistently exceeded – usually, by a substantial margin – the corresponding rates of both New York City and New York state. In 2000, as the U.S. was recovering from the crack epidemic of the nineties, our high-rate precincts’ mean violent crime rate (1488.6) was nearly twice the city’s 790.4 and 2.7 times worse than the state’s 553.9. (In fact, the 41st. precinct’s sky-high 2000 rate of 1913.5 was far worse than the state’s 1990 rate and nearly equaled the city’s). By 2022, our high-violence precincts’ mean rates were 2.5 times worse than the city’s and 3.1 times worse than the state’s.
Bottom line: citywide rates seriously understate the impact of violent crime on less prosperous areas. Our Neighborhood posts consistently demonstrate a profound connection between local economic conditions and violent crime. That’s not just in La-La land and the Big Apple. Check out New Orleans (“Hard Times in the Big Easy”). And San Antonio (“San Antonio Blues”). And South Bend, Indiana (“Human Renewal”). And Portland and Minneapolis (“Don’t Divest – Invest!”).
Be sure to check out our homepage and sign up for our newsletter
Most of our readers are well aware that poverty and violence are closely linked. So why would a top economist make sweeping conclusions about crime without addressing within-city differences? Perhaps he wished to avoid implying that poor people are evil. Yet poverty undoubtedly plays a major role in setting the stage for the violence that besets the good, law-abiding residents of lower-income areas. After recent shootings in South Los Angeles’ violence-beset Watts neighborhood (it’s in Southeast Division), the leader of a local peace coalition observed that citywide declines in shootings and murders “don’t necessarily reflect our reality.” According to an L.A.-area gang interventionist, this “reality” can make normal life in poor areas impossible. “It’s time for our children to be able to play outside, be able to walk to and from school safely…Because we want to make sure that our kids grow up to be doctors and lawyers and police officers and firefighters...This isn’t a color thing.”
What to do? While cops do matter, the answer lies way beyond policing. Once again, let’s self-plagiarize from “Fix Those Neighborhoods!”:
Yet no matter how well it’s done, policing is clearly not the ultimate solution. Preventing violence is a task for society. As we’ve repeatedly pitched, a concerted effort to provide poverty-stricken individuals and families with child care, tutoring, educational opportunities, language skills, job training, summer jobs, apprenticeships, health services and – yes – adequate housing could yield vast benefits.
Set aside all that ideological gibberish. For this Administration, and the one after that, fixing neighborhoods is Job #1. We’re (still) waiting!
UPDATES (scroll)
5/16/24 A deep-dive by the New York Times into fatal shootings across the U.S. revealed
substantially higher percentages during the pandemic years in the percentage of city residents who live within a quarter-mile of at least one
killing. In large cities, the proportion rose from 31% during 2016-19 to 38% during 2020-2023. Cities with traditionally high rates of violence experienced the largest gains. In Atlanta the increase was from 36% to 58%; in Columbus, from 28% to 41%. Throughout, the residents of poorer neighborhoods were the most substantially affected.
5/13/24 In January then-LAPD Chief Michel Moore touted a 17 percent reduction in Los Angeles homicides, from 392 in 2022 to 327 in 2023. Robberies and nonfatal shootings were also down, and reported violent crime fell three percent. But according to LAPD’s 2023 use of force year-end review, officer-involved shootings (OIS) increased, going from 31 to 34, and major (“categorical”) uses of force increased from 53 to 70. And while five fewer suspects in 2023 OIS incidents were armed with guns, eleven more were armed with other weapons. LAPD report
2/13/24 In New York City’s violence-stricken Bronx, a quarrel between teens on a subway train led to gunfire as passengers debarked during the Monday afternoon rush hour. A 34-year old man was killed and five persons were wounded, including a 14-year old girl and a 15-year old boy. Commenting on the episode, NYC Mayor Eric Adams, who has touted a citywide crime drop, lamented that “not only people must be actually safe, but what we have done in lowering crime, they must feel safe.”
11/17/23 Juvenile deaths by gunfire are soaring in Chicago, with “twelve shot in under two weeks.” Fifty-five Chicago youths under eighteen have been shot and killed in 2023, compared with sixty-six in all of 2022. Across the U.S., at a Las Vegas high school campus, ten students beat another to death over “headphones and a vape pen.” So far eight have been charged with murder. In both cities, the killings struck in chronically beset and poor neighborhoods. In Chicago, it was Austin, Avalon Park and East Side; in Las Vegas, the high school is located in a Zip code (89101) with 31.2% poverty.
11/14/23 “An Unlikely Partnership.” That’s how BJA describes its Community Based Violence Intervention and Prevention Initiative. It has funded eighty-six programs in crime-beset inner-city neighborhoods that partner police, affected residents and gang members in collaborations that “prevent violence, strengthen community resilience, and build social capital”. As part of this approach, former inmates are provided job opportunities and involved in “intensive, long-term programs designed to change their behavior.”
|
Did you enjoy this post? Be sure to explore the homepage and topical index!
Home Top Permalink Print/Save Feedback
RELATED POSTS
Neighborhoods special topic
All in the Family (II) De-Prosecution? What’s That? America’s Violence-Beset Capital City
Good News/Bad News Policing Can’t Fix What Really Ails San Antonio Blues
Hard Times in the Big Easy Woke Up, America! Place Matters Don’t Divest – Invest!
Fix Those Neighborhoods! Human Renewal Be Careful What You Brag About (II)
Posted 10/18/23
POLICING CAN’T FIX WHAT REALLY AILS
California’s posturing overlooks a chronic issue
For Police Issues by Julius (Jay) Wachtel. two months ago Cal DOJ’s Office of Gun Violent Prevention (OGVP) released “The Impact of Gun Violence in California.” A data-rich thirty-seven page report, it sings the praises of the Golden State’s achievements in reducing gun violence since the bad-old days of the nineteen-nineties. As those of us who then labored in the trenches well remember, that’s when the crack epidemic beset our nation’s inner cities and transformed south Los Angeles and its equivalents elsewhere into virtual combat zones.
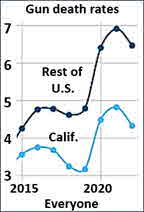 But OGVP’s bragging doesn’t end there. California’s But OGVP’s bragging doesn’t end there. California’s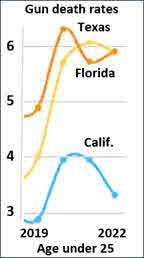 more recent gun violence statistics draw prominent, highly favorable) mention. Pointing to CDC Wonder’s firearms-related death data for 2013-2022, the report boasts that “if the firearm mortality rate in the rest of the U.S. matched California’s over this same period, there would have been nearly 140,000 fewer firearm-related deaths across the nation in that decade alone, and potentially hundreds of thousands fewer gunshot injuries” (p. 13, emphasis ours). Those views are bolstered by graphs based on per/100,000 gun death rates; one (see left) contrasts California with the U.S. overall (p. 10); another (see right) with the two other most populous states, Texas and Florida, for persons under 25 (p. 12). more recent gun violence statistics draw prominent, highly favorable) mention. Pointing to CDC Wonder’s firearms-related death data for 2013-2022, the report boasts that “if the firearm mortality rate in the rest of the U.S. matched California’s over this same period, there would have been nearly 140,000 fewer firearm-related deaths across the nation in that decade alone, and potentially hundreds of thousands fewer gunshot injuries” (p. 13, emphasis ours). Those views are bolstered by graphs based on per/100,000 gun death rates; one (see left) contrasts California with the U.S. overall (p. 10); another (see right) with the two other most populous states, Texas and Florida, for persons under 25 (p. 12).
Click here for the complete collect ion of crime & punishment essays
What’s behind California’s comparatively benign gun-violence score? According to OGVP, aggressive enforcement, “affirmative litigation” and lawmaking play key roles. Authorities have taken firm measures to combat the proliferation of ghost guns, those unserialized instruments of death that can readily fall into the hands of unsavory characters and the underaged. “Red Flag Laws” enable family members, caregivers and police to seize guns from risky persons, including family members, before they strike. And prohibitions on lethal implements such as assault weapons and large-capacity magazines, which are often used to commit mass murder, have supposedly made the state “a leader in efforts to help intervene and prevent shootings before they occur.”
And so on and so forth. It’s not until page 32 of the 37-page report that attention shifts to the possible causes of gun violence. The focus is on race and gangs:
…in 2020-2021, the modal patient hospitalized for nonfatal gun assault injuries in California was a Hispanic or Black male in his 20’s, admitted to the hospital on a weekend, hospitalized for over one week, and publicly insured through Medi-Cal…(p. 33)
…Researchers with the National Network for Safe Communities examined data from nearly two dozen cities across the U.S. and found that on average, at least half of homicides and 55% of nonfatal shootings in those cities were perpetrated by and/or against people known by law enforcement to be affiliated with gangs, “street groups,” or social networks engaged in violence…(p.36)
We’ve often written about the well-known, thoroughly documented relationship between poverty and violence (see, most recently, “Good News/Bad News”). But OGVP’s report doesn’t use the words “poor” or “poverty” – not even once. “Income” comes up twice. Once at the beginning, where it’s mentioned in passing that U.S. residents “are 25 times more likely to be killed in a gun homicide than those living in other high-income countries” (p. 2, emphasis ours). And once near the end, where the authors note that “interpersonal gun violence disproportionately impacts people who have lower income and economic security” (p. 33, emphasis ours).
OGVP’s report seems focused on praising California’s response. Perhaps that’s why it essentially ignores the socioeconomic factors that might actually “cause” firearms violence. We’ve emphasized poverty (POV), but other villains are likely involved. Giffords, for example, ranks states according to gun law strength (GLS). RAND has collected data on rates of household firearms ownership (HFR), by state. Another possible influencer, law enforcement employee staffing (LEE), was one of the management measures gathered by the UCR (it’s now transitioned to the NIBRS).
So we decided to run our own statewide analysis. Percent of persons in poverty by state (POV) is drawn from the Census. Gifford’s GLS is on a scale of 1-50 (strongest to weakest). For simplicity, we inverted it so that higher numbers mean stronger state gun laws. RAND’s HFR uses a scale of zero (0) to one (1.0) to represent the proportion of adults in each state who reside in a household with at least one firearm. And LEE represents the ratio of law enforcement employees (sworn and non-sworn) per 1,000 population, by state, as reported by the UCR and NIBRS. (Note: Because the UCR-NIBRS transition remains a work in progress, our data for POV, GLS and LEE is for 2019, the UCR’s last year. HFR gun ownership data represents 2016, when it was apparently last collected.
One possible influencer was left out. Unlike our other factors, which are on scales, “stand your ground” (SYG) laws are either in effect, or not. Their assessment is also complicated by the fact that they’ve come into play over time. But fear not – we recently addressed them in depth. For more on their possible role check out our recent piece, “Fearful, Angry, Fuzzy-Headed. And Armed”.
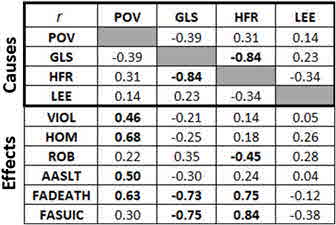 This matrix displays data for all fifty states. Hypothesized “causes” are in the top box. There are four: POV (poverty), GLS (gun law strength), HFR (household firearms ownership) and LEE (law enforcement staffing). Six “effects” occupy the bottom box. Four are from the 2019 UCR: VIOL (violence rates), HOM (criminal homicide rates), ROB (robbery rates) and AASLT (aggravated assault rates). Each is a state rate per/100,000 pop. and includes both gun and non-gun crimes. Two additional “effect” measures, FADEATH (gun deaths) and FASUIC (gun suicides) also denote state rates per/100,000 pop. Both are from CDC Wonder. This matrix displays data for all fifty states. Hypothesized “causes” are in the top box. There are four: POV (poverty), GLS (gun law strength), HFR (household firearms ownership) and LEE (law enforcement staffing). Six “effects” occupy the bottom box. Four are from the 2019 UCR: VIOL (violence rates), HOM (criminal homicide rates), ROB (robbery rates) and AASLT (aggravated assault rates). Each is a state rate per/100,000 pop. and includes both gun and non-gun crimes. Two additional “effect” measures, FADEATH (gun deaths) and FASUIC (gun suicides) also denote state rates per/100,000 pop. Both are from CDC Wonder.
We use the “r” statistic to denote the relationships among the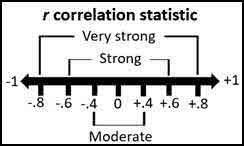 four causal variables, and between each causal variable and each effects variable. It’s on a scale of -1 to +1. Positive r’s indicate that variable scores increase and decrease together; negative r’s, that they move in opposite directions. An r of zero (there are none) denotes absolutely no relationship, while a “perfect” r of -1 or +1 (there are none) indicates a relationship in perfect lockstep. Relationships that are moderate (r= 0.4-0.59), strong (r= 0.6-0.79) and very strong (r= 0.8 & above) are in boldface. For example, go to the POV column. POV’s relationship with VIOL is a moderate 0.46, and its r with HOM is a strong 0.68. Shift to the HFR column. Grab a look at its very strong, 0.84 relationship with FASUIC. As one variable’s score increases or decreases so does the other’s, and in very close sync. four causal variables, and between each causal variable and each effects variable. It’s on a scale of -1 to +1. Positive r’s indicate that variable scores increase and decrease together; negative r’s, that they move in opposite directions. An r of zero (there are none) denotes absolutely no relationship, while a “perfect” r of -1 or +1 (there are none) indicates a relationship in perfect lockstep. Relationships that are moderate (r= 0.4-0.59), strong (r= 0.6-0.79) and very strong (r= 0.8 & above) are in boldface. For example, go to the POV column. POV’s relationship with VIOL is a moderate 0.46, and its r with HOM is a strong 0.68. Shift to the HFR column. Grab a look at its very strong, 0.84 relationship with FASUIC. As one variable’s score increases or decreases so does the other’s, and in very close sync.
Let’s begin. We’ll take it one “effect” at a time.
- State violent crime rates (VIOL): Poverty has the only effect of note, an r of 0.46. Its sign is positive and the relationship is moderate, meaning that as percent of residents in poverty increases, violence rates also tend to get worse. Only “glitch” is that “violent crimes”, as defined by the UCR, include non-gun incidents. But the implication is clear: more poverty = more violence.
- State aggravated assault rates (AASLT): Poverty is the only causal variable with at least a moderate relationship. Again, it’s positive, meaning that aggravated assaults - which also include non-gun incidents - are more likely in poorer areas.
- State criminal homicide rates (HOM): Poverty is again the only causal variable of note. Its influence is evident in the left graph. The correlation, a strong r of 0.68, is “positive”, meaning that as the proportion of a state’s poor residents goes up, so do its homicide rates. Since guns are the most common way to accomplish murder, their role in the relationship seems assured.
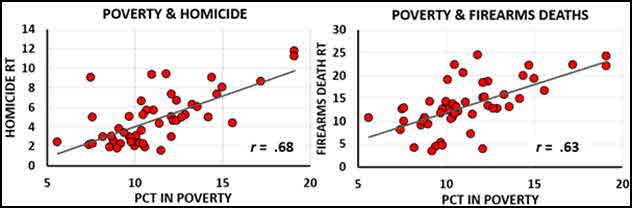
- Firearm death rates (FADEATH): This effect variable, which specifically addresses gun deaths, has a strong relationship with poverty (r=o.63, above right) and two other “causes”: state gun law strength and state household firearms ownership (see below). Note that the direction of the relationship between GLS and FADEATH is “negative”: as gun laws get stronger, gun death rates decrease.
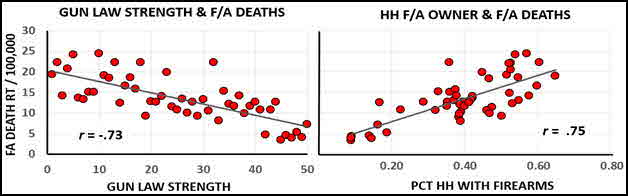
There is a little “glitch”. Our introductory matrix revealed that GLS and HFR are strongly correlated (-0.84). 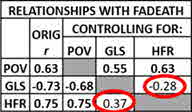 So we recomputed their individual relationships with FADEATH while “controlling” (removing) their partner’s possibly additive effects. Sure enough, check out the r’s circled in red. Once the counterpart’s influence is removed, those strong relationships that GLS (-0.73) and HFR (0.75) enjoyed with FADEATH now fall below the .40 threshold of moderate strength. On the other hand, poverty’s strong r of 0.63 with FADEATH is unaffected when HFR is removed from the picture, and remains a considerable 0.55 when the influence of GLS is taken out. Bottom line: poverty wields a big stick on its own, while GLS and HFR seem far more influential as a team. So we recomputed their individual relationships with FADEATH while “controlling” (removing) their partner’s possibly additive effects. Sure enough, check out the r’s circled in red. Once the counterpart’s influence is removed, those strong relationships that GLS (-0.73) and HFR (0.75) enjoyed with FADEATH now fall below the .40 threshold of moderate strength. On the other hand, poverty’s strong r of 0.63 with FADEATH is unaffected when HFR is removed from the picture, and remains a considerable 0.55 when the influence of GLS is taken out. Bottom line: poverty wields a big stick on its own, while GLS and HFR seem far more influential as a team.
- Firearm suicide rates (FASUIC): Firearms suicide rates can’t be attributed to poverty. Their correlation
 literally drops to zero when either GLS or HFR are taken into account. Nor, as our “controlling for” exercise demonstrates, are firearm suicides substantially driven by gun law strength. Check out those red circles. Note how the r between GLS and FASUIC (-0.75) plunges to a measly -.015 once HFR, with which GLS is closely linked (-0.84), comes into the picture. Reversing that, HFR retains a heady relationship with FASUIC (r=0.59) even after we remove GLS’s contribution. In the end, the real driver of firearms suicide seems to be gun availability. And that makes perfect sense. literally drops to zero when either GLS or HFR are taken into account. Nor, as our “controlling for” exercise demonstrates, are firearm suicides substantially driven by gun law strength. Check out those red circles. Note how the r between GLS and FASUIC (-0.75) plunges to a measly -.015 once HFR, with which GLS is closely linked (-0.84), comes into the picture. Reversing that, HFR retains a heady relationship with FASUIC (r=0.59) even after we remove GLS’s contribution. In the end, the real driver of firearms suicide seems to be gun availability. And that makes perfect sense.
We came to near-identical conclusions two-and-a half years ago when a string of massacres befell our tortured land (“Four Weeks, Six Massacres”). And despite Giffords’ and OGVP’s bountiful praise of California’s supposedly stern approach to regulating firearms, nothing’s really changed. Its assault weapons “ban”, for example, continues to be mostly an effort in pretending to regulate. Here’s some self-plagiarism from “An American Tragedy”:
But don’t California’s “strong” gun laws prohibit “assault weapons”? Technically yes, but the devil is in the details. For example, if a gun has a removable magazine, it can’t sport features such as a protruding pistol grip. Wily manufacturers have adapted with a host of legal variants.
Our essay depicted the “California-legal” rifles used in the 2015 San Bernardino massacre. So have things changed? Grab a look at the AP photo of a gun display in a Los Angeles-area gun store. According to the accompanying L.A. Times piece (it’s niftily entitled “A troubling California trend: More violent crimes with guns even as restrictions tighten”) gun violence has changed. It’s gotten worse.
Reacting to the crisis, California Governor Kevin Newsom just signed a cluster of bills, from SB 2, which “strengthens California’s restrictions regarding public carry laws by enhancing the existing licensing system”, to AB 732, which “strengthens the process for removing firearms from people who are prohibited from owning them due to a criminal conviction.” However well-intentioned, these laws fail to address the socioeconomic problems that, as our “Neighborhoods” posts regularly point out, underlie violent crime (see, for example, “What’s Up. Violence. Where? Where Else?”). As the below table demonstrates, this consequence is readily apparent at the level of police precincts.
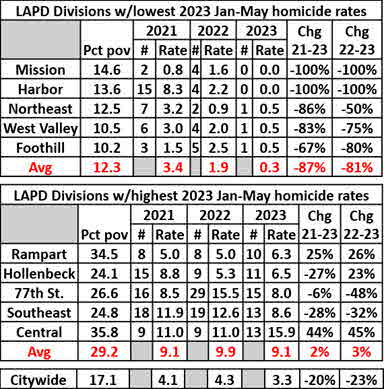
Our recent essay about violence in Los Angeles, “Good News/Bad News” compared LAPD Divisions at each end of the homicide, aggravated assault and robbery spectrum during the first five months of 2021, 2022 and 2023. This time we used LAPD data to compare violent crime rates and shooting victim rates per/100,000 pop. during the January 1-September 30 periods in 2021 and 2023 for the five LAPD Divisions at each extreme of the violent crime spectrum:
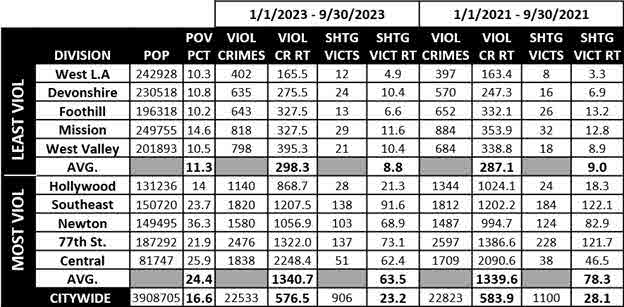
- Violent crime. Citywide, LAPD reported a January 1-September 30 drop from 22,823 in 2021 to 22,533 in 2023. That’s only one-point-three percent. And as one would expect, the benefits weren’t equally dispersed. Two Divisions in the “least violent” group (West Valley and Devonshire) experienced substantial upticks. As for the “most violent” group, ups and downs among its members produced virtually the same average rates for both periods.
- Shooting victims. Similar ups and downs led to virtually no change in the average number of shooting victims of the five “least violent” Divisions. However, the mean score of the “most violent” group materially improved. That was due to substantial drops in the number of victims in Southeast, Newton and, especially, 77th. St. Division. But rates in Hollywood and, particularly, Central Division worsened.
We don’t discount that whatever improvements took place – again, note the substantial decline in shooting victims in 77th. St. Division – may have been produced by more attention to local needs. Or, say, more vigorous policing. But differences between Divisions remained pronounced. In 2023 LAPD’s five most violent Divisions had a violent crime rate four and one-half times worse, and its citizens were being shot more than seven times more frequently, than residents of the five least violent Divisions.
Be sure to check out our homepage and sign up for our newsletter
What underlies these dramatic between-group differences? Grab a look at our introductory bar graph. Then glance at the above table’s “POV PCT” column. High-violence divisions had more than twice the percentage of residents living in poverty (see “Good News/Bad News” for how Division poverty rates were calculated.) And that unholy alliance between poverty and violence extends far beyond our ten-Division sample. These scattergrams, which represent all 21 LAPD Field Divisions (each is a “dot”) demonstrate the strong association between poverty and 2023 violent crime, and between poverty and 2023 shooting victims, throughout the “City of Angels”:
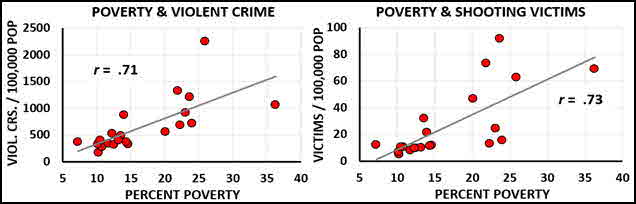
That’s why “feel good” pieces such as a recent L.A. Times article that boasts of a substantial drop in “overall” violence leave us a bit cold. What to do? Vigorously address the underlying issue. As our Neighborhoods posts frequently point out, crime, and particularly violent crime, reflects the consequences of living in deprivation. And that’s not something that even the best policing can hope to correct.
UPDATES (scroll)
10/21/24 A fight between young men at the mass celebration of a high school homecoming football victory devolved into a shooting, killing two 19-year olds and a 25-year old and wounding eight others. It happened on a rural trail near Lexington, Mississippi, in poverty-stricken Holmes County (poverty 35%.) Sheriff Willie March confirmed that gunplay has been a problem. “These are young men walking around with weapons. I wish I had an answer.”
7/22/24 An in-depth study of a representative sample of nearly 1,000 Chicago residents revealed that the wide disparities in arrests experienced by Blacks, Hispanics and Whites as they grow into adulthood are produced by “exposure to cumulative childhood advantages and disadvantages rather than from race-specific effects.” These root causes include neighborhood violence, segregation and poverty and corresponding factors such as having a single parent and not growing up in a family-owned home.
|
Did you enjoy this post? Be sure to explore the homepage and topical index!
Home Top Permalink Print/Save Feedback
RELATED POSTS
Neighborhoods special topic
A Money Pit All in the Family (II) Want Brotherly Love? Don’t Be Poor! Is Crime Really Down?
Kids With Guns Ideology (Still) Trumps Reason Shutting the Barn Door See No Evil - Hear No Evil
Fearful, Angry, Fuzzy-Headed. And Armed. Are We Helpless To Prevent Massacres?
Good News, Bad News Four Weeks, Six Massacres Red Flag at Half-Mast (I) (II)
Posted 6/16/23
GOOD NEWS / BAD NEWS
When citywide crime “falls,” who really benefits?
For Police Issues by Julius (Jay) Wachtel. Our attention was recently drawn to a Los Angeles Times piece with an unusually explicit Internet link: https://www.latimes.com/california/story/2023-06-01/crime-is-down-in-la-as-city-plans-to-expand-lapd. Entitled “What the latest police numbers show about crime in L.A., San Francisco and West Hollywood”, its message (greedy cops) was so obvious that progressively-minded readers might have been forgiven for simply nodding and moving on.
But as a long-time, home-delivery subscriber, we dove in. And quickly realized that the supposedly well-researched article was really just another feel-good account about L.A.’s citywide crime decline. Citing police data, it reported that L.A.’s 2023 violent crime rate was “more than 10%” lower than for the same Jan. 1-May 20 period last year. Homicide, in particular, had plunged a substantial twenty-seven percent. (Click here for our saved version of an LAPD report containing city-wide crime numbers for January 1-May 27 periods in 2021, 2022 and 2023.)
Click here for the complete collection of crime & punishment essays
Forgive us if we're not impressed. As our neighborhoods essays have long harped, people live and work in places whose characteristics can’t be accurately depicted with citywide scores. “What’s Up? Violence. Where? Where Else?” compared neighborhoods across Los Angeles and New York City. “Don’t Divest – Invest” did so for Portland and Minneapolis. And “Punishment Isn’t a Cop’s Job (II)” focused on Memphis. It’s long been our practice to focus on crime rates in areas within cities. And we always bring their poverty rates along. No, it’s not because we think that poverty “causes” crime. After all, most poor people are perfectly law-abiding. But poverty has proven to be a worthy surrogate indicator for a host of more proximate factors, from gang activity to unemployment, that are closely linked to violence.
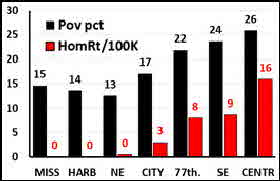
Here we’re doing it again, and again for L.A. Our top image displays poverty and homicide rates per 100,000 population between January 1 and May 27, 2023 for six LAPD geographical Divisions (there are twenty-one) that populate the extremes of the homicide spectrum, with three at each end. L.A.’s “citywide” rate is in the middle. These tables extend that comparo to five Divisions at each end, and expands coverage to include the other two major crimes of violence: aggravated assault and robbery:
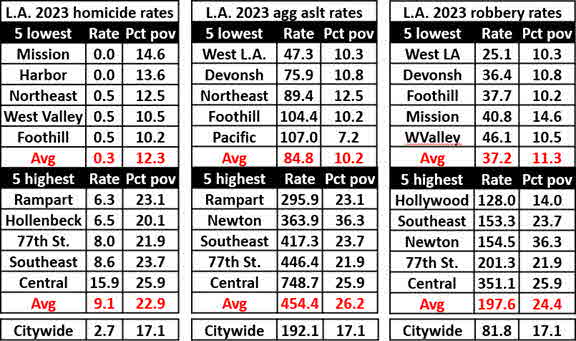
Crime rates were computed using LAPD Division crime stat’s and population figures. Division poverty scores were produced as in “Does Race Drive Policing?”, by overlaying precinct and ZIP code maps, then averaging Census poverty statistics. Divisions appear in both groups (“lowest” and “highest”) by their crime rate, from least to most.
Within each crime type, comparing the five lowest and five highest crime-burdened precincts yields stark differences in crime rates and percent of the population in poverty. High-homicide rate precincts, for example, have an average homicide rate (9.1) that’s more than thirty times that of their low-homicide counterparts (0.3). Their average poverty score is also twice as high. Like contrasts are evident for aggravated assault and robbery. And that's not just something that came about in 2023. In the next set of tables we use saved LAPD data to extend our coverage to equivalent periods in 2021 and 2022 (# represents the actual number of crimes). We begin with homicide:
Here’s aggravated assault:
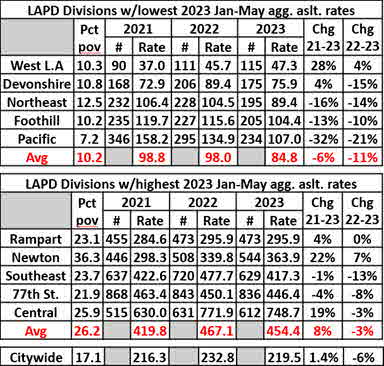
And here’s robbery:
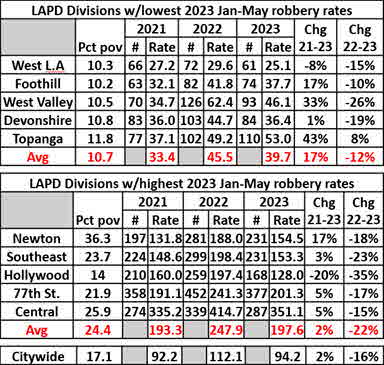
Average poverty scores for the highest-rate groups was substantially higher than for the lowest-rate groups for each year and crime type. Really, the pronounced connection between violent crime and poverty could hardly be more obvious. And unlike those comparatively benevolent “citywide” crime numbers (you know, the ones that the bosses like to brag about), the crime rates rates of “highest-crime” precincts didn’t consistently improve.
It’s not that the worker-bees are ignoring the obvious. That violence/poverty connection clearly influences how cops go about their business. In “Does Race Drive Policing?” we used 2022 LAPD RIPA stop data along with 2019 LAPD arrest data and Census ZIP code data to confirm that Black and Hispanic persons are more likely to be stopped and arrested. No, it’s not because most cops are racists. It’s because Blacks and Hispanics disproportionately inhabit the economically disadvantaged areas whose chronically elevated levels of violence draw increased police attention. (It’s not the first time we’ve pointed that out, nor criticized the L.A. Times for jumping to conclusions. See our 2019 two-parter, “Did the Times Scapegoat L.A.’s Finest? [I] [II]”).
That’s all well and good. But our exploration here has only touched on the extremes. LAPD has twenty-one field Divisions. What about the city as a whole?
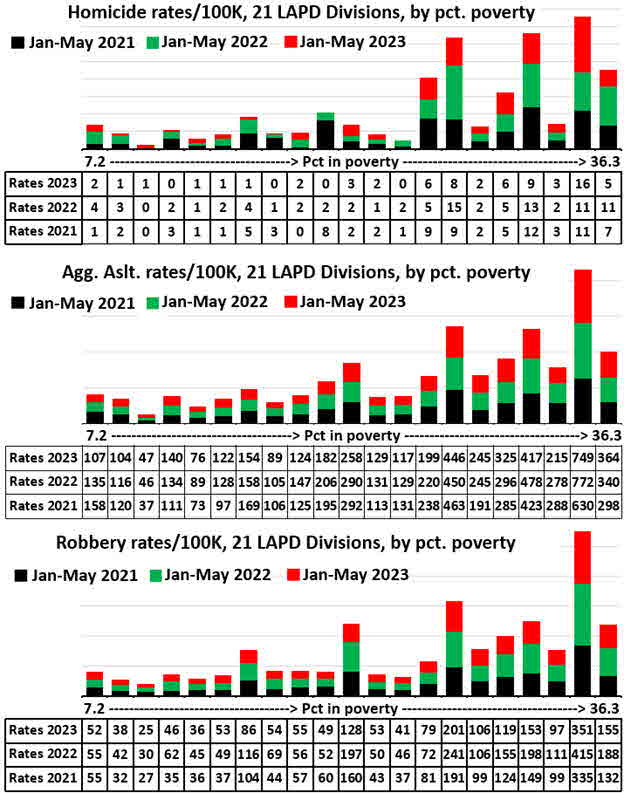
These graphs arrange LAPD’s twenty-one field Divisions by percent of residents in poverty, from lowest poverty precinct (7.2 percent) on the left, to highest poverty precinct (36.3 percent) on the right. On first glance, crime rates appear to substantially worsen at the higher levels of deprivation. To more precisely assess the relationships between our “variables” – poverty and crime type – we computed “r” scores (coefficient of correlation) from January-May 2023 crime data. [The “r” statistic ranges from zero to plus or minus one. Zero means no relationship between variables: they move up and down independently. A substantial “plus” score – say, .50 or higher – suggests that the variables move up and down together. A substantial “minus” score also means that they change in sync, but move in opposite directions.]
Our results show strong, positive r’s between poverty and each violent crime type: .64 between poverty rate and homicide, .73 between poverty rate and aggravated assault, and .68 between poverty rate and robbery. Here are the “scattergrams” (each dot represents a Division):
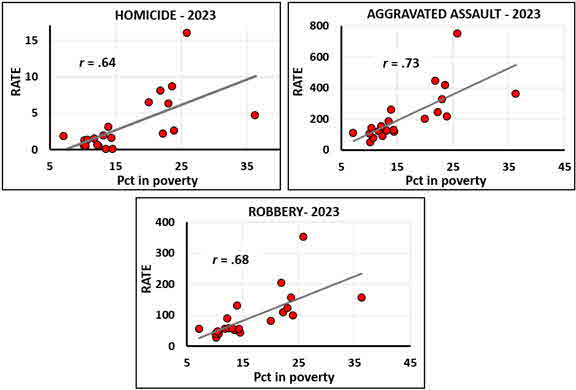
Fine, poverty and violence go together. But does that extend to serious property crime? Say, burglary? Here’s that comparo:
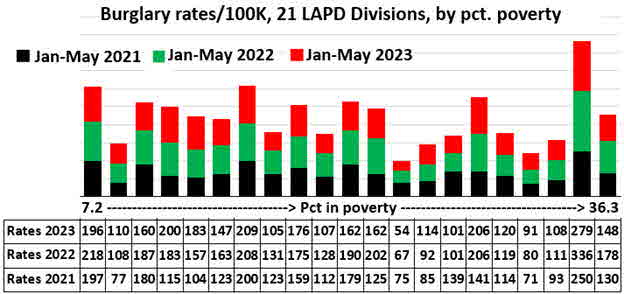
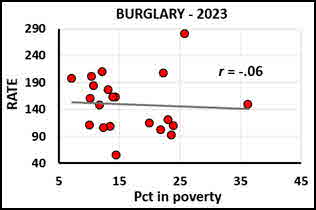
As the near-zero r demonstrates, poorer areas of Los Angeles don't generally suffer from higher rates of burglary. And that's to be expected. Considering the places where material goods worthy of stealing can be found, serious property offenses should be far more evenly distributed across the economic spectrum than violent crime. (That’s especially so in California, which in 2014 reclassified as misdemeanors most thefts whose value doesn't exceed $950.)
Be sure to check out our homepage and sign up for our newsletter
So what's the uptake? As “Place Matters” pointed out, cities that are blessed with lots of prosperous neighborhoods (e.g., the Big Apple and L.A.) flaunt aggregate crime scores that don’t reflect the violent realities that their less well-off residents face. But leave honest reporting aside. How is the violence that besets poor areas best approached? Let's self-plagiarize from “Fix Those Neighborhoods!”:
Yet no matter how well it’s done, policing is clearly not the ultimate solution. Preventing violence is a task for society. As we’ve repeatedly pitched, a concerted effort to provide poverty-stricken individuals and families with child care, tutoring, educational opportunities, language skills, job training, summer jobs, apprenticeships, health services and – yes – adequate housing could yield vast benefits.
Couldn't have said it better ourselves! Oh, wait…
UPDATES (scroll)
4/25/25 Mob shoplifts committed by hordes of bicycle-riding teens are besetting Los Angeles-area retailers. In the latest episode, an estimated three-dozen youngsters swarmed a supermarket located near the USC campus. They raided its shelves, hurled items at security guards who dared to interfere, and threw rocks at a parked car occupied by a married gay couple. In a recent episode a group “punched and kicked” a driver who confronted them. It was captured on video, as was a similar assault last year.
6/19/24 Violent crime has a way of intruding into assumedly “safe” places. Say, a residential area of Tustin, an upscale L.A. suburb, where an off-duty member of the President’s Secret Service detail was accosted by an armed robber (he’s still on the lam). Or, say, L.A.’s tony Venice neighborhood, featuring miles of canals lined by “multimillion dollar homes.” But an unhoused intruder nonetheless made his way in. Francisco Jones, 29, has been charged with brutally pummeling and sexually assaulting two middle-aged residents, leaving one unconscious and near death. Long troubled by homeless souls, a “shaken community” is now struggling about how to respond.
12/18/23 In a recent audit, the Los Angeles City Controller criticized how LAPD deploys its helicopters. For example, “the 77th Street Area in South Los Angeles had the largest share of flights relative to Part I crimes, while the Pacific Area in West Los Angeles had the fewest.” Heavy deployment, it claims, affects the quality of life and can “create equity concerns if certain communities are subject to over-policing.” But the audit aggregates serious property crimes, of which the poor 77th. Street area has relatively few, and crimes of violence, whose high rate makes 77th. Street one of most dangerous places in the city.
12/4/23 Citywide, Chicago homicide is down 12 percent so far this year, from 644 to 569 thru November 26. But the Chicago Tribune isn’t celebrating. According to its analysis, the gain reflects improvements in the city’s traditionally peaceful areas. Say, Rogers Park (CPD Dist. 24), where homicides dropped 21%, from 14 to 11. But the city’s notoriously violent areas have remained so. For example, murders in Englewood (CPD Dist. 7) increased from 51 to 55. That’s 8 percent worse.
8/7/23 An unknown gunman opened fire during a gang-violence prevention gathering at a recreation center in LAPD’s violence-beset Harbor Division. Four persons were wounded, one critically. The Director of L.A.’s Urban Peace Institute bemoaned what area residents actually face. “Even though generally the numbers say L.A. is safer in the last couple years because shootings and homicides are down, the reality of this is it impacts a lot of people who live in those communities.”
8/3/23 “The safety numbers that are reflected citywide don’t necessarily reflect our reality.” That’s how the executive director of L.A.’s Urban Peace Institute described the gap between the city’s favorable overall violence numbers and life in beset, poverty-stricken Watts, where shootings recently wounded nine and killed two. As a gang interventionist said, “it’s about safety. This isn’t a color thing.” Community leaders have advised residents to avoid congregating in groups for the rest of the year.
7/11/23 L.A.-area taco stands and fruit and vegetable vendors are beset by armed robberies. On July 9th there were four within an hour. Each was carried out by “three young men in dark hooded sweatshirts”, and each took place in the usual place: violence-beset South Los Angeles. In March LAPD’s 77th. Street Division, which covers that area, tweeted a bilingual alert warning that the danger seems to peak during the late night hours.
|
Did you enjoy this post? Be sure to explore the homepage and topical index!
Home Top Permalink Print/Save Feedback
RELATED POSTS
Neighborhoods special topic
Want Brotherly Love? Don’t Be Poor! Is Crime Really Down? It Depends...
America’s Violence-Beset Capital City See No Evil-Hear No Evil Policing Can’t Fix What Really Ails
Confirmation Bias can be Lethal San Antonio Blues Does Race Drive Policing?
Punishment Isn’t a Cop’s Job (II) What’s Up? Violence. Where? “Woke” Up, America!
Don’t Divest – Invest Place Matters Fix Those Neighborhoods!
Did the Times Scapegoat L.A.’s Finest? [I] [II] Repeat After Us: “City” is Meaningless
Posted 5/30/23
IS DIVERSION THE ANSWER?
California authorized a new approach.
Los Angeles ran with it. But, yes, there are limits.
For Police Issues by Julius (Jay) Wachtel. If you’ve labored in the criminal justice workplace, closing a major city’s principal jail (even if only “eventually”) while “ensuring public health and safety” might seem a reach. But the goal of Los Angeles County’s Justice, Care, and Opportunities Department (JCOD), which was formed last year, didn't arise from thin air. In January 2019 California enacted Penal Code section 1001.36, which authorizes trial court judges to grant pretrial diversion for up to two years in all but the most serious crimes (murder, voluntary manslaughter and rape are among the disqualifying) to persons who are seriously mentally ill.
What’s needed? The burden of proof falls on the defense. It must submit an expert opinion that the accused suffers from a mental disorder recognized by the DSM, including “bipolar disorder, schizophrenia, schizoaffective disorder, or post-traumatic stress disorder, but excluding antisocial personality disorder, borderline personality disorder, and pedophilia.” What’s more, the malady must have been “a significant factor in the commission of the charged offense” and is amenable to treatment. Prosecutors are free to object, and jurists get a broad escape clause:
(b)(1)(F) The court is satisfied that the defendant will not pose an unreasonable risk of danger to public safety, as defined in Section 1170.18, if treated in the community. The court may consider the opinions of the district attorney, the defense, or a qualified mental health expert, and may consider the defendant's violence and criminal history, the current charged offense, and any other factors that the court deems appropriate (emphases ours).
Click here for the complete collection of crime & punishment essays
Prospective patients must agree to a comprehensive plan, which can include treatment in a residential facility, and their progress must be regularly reported. If they succeed, charges are dismissed; if they fail or commit another crime, their prosecution is revived.
With progressively-minded District Attorney George Gascon in charge, mental health diversion seems a particularly good fit for Los Angeles. (Check out the video on the DA’s website). But mental health diversion isn’t just something that progressively-inclined California dreamt up. In 2019 a Federal entity, the State Justice Institute, awarded more than a million dollars to the National Center for State Courts (NCSC) “to develop resources, best practices and recommend standards” for dealing with mentally ill persons who commit crimes (grant SJI-19-P-019). NCSC’s final report, “Judge’s Guide to Mental Health Diversion,” came out in November. Throughout, its tone is unfailingly favorable:
The incarceration of people with serious mental illness, often for minor crimes, is
expensive and results in negative outcomes for the individuals, their families, and their communities. Even short stays in jail often make mental illness symptoms worse and increase the likelihood of recidivism. In response, courts and communities are increasingly looking to design and implement diversion strategies that identify those individuals who can and should be steered away from the criminal justice system, and toward appropriate treatment.
Indeed, the notion of diversion has taken hold in jurisdictions across the U.S. (For examples in Florida and Kansas, click here and here.) But what do statistics show? Does diversion work? Does it reduce recidivism? Violent crime? Alas, L.A. County’s October 5, 2022 report indicates that methods to statistically “evaluate which programs and interventions are operating as intended and which have a disparate impact” remain on the drawing board (p. 48). Bottom line: none of the gushing opinions are supported with numbers. And there’s no relief in sight.
In fact, what figures there are suggest that the practice faces immense challenges. On May 11, 2022 the Men’s Central Jail held 12,977 inmates. Of these, seventy percent (9,150) had been charged with or convicted of a violent felony, and forty-six percent (6,025) awaited trial. Of the latter group, “most” were accused of a “serious or violent” felony. Based on these sobering facts, the county’s jail closure team concluded that judges were unlikely to simply let folks go:
While the Court is ultimately responsible for making release decisions, it is unlikely to release large numbers of individuals held on serious or violent felony charges — which includes the majority of people currently held in the County jail system — without significant investment and expansion of the infrastructure available to support a person if released (Attachment III, p. 2).
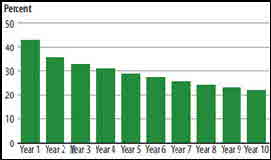 Problem is, as we recently reported in “A Broken System”, that “infrastructure” seems far from sturdy. A 2021 BJS report, “Recidivism of Prisoners Released in 24 States in 2008”, revealed that 81.9 percent of releasees were rearrested within ten years; 39.6 percent for a violent crime and 47.4 percent for a property crime (Table 11). Those charged with violent crimes were most likely to commit one again. Problem is, as we recently reported in “A Broken System”, that “infrastructure” seems far from sturdy. A 2021 BJS report, “Recidivism of Prisoners Released in 24 States in 2008”, revealed that 81.9 percent of releasees were rearrested within ten years; 39.6 percent for a violent crime and 47.4 percent for a property crime (Table 11). Those charged with violent crimes were most likely to commit one again.
L.A. County’s program, which launched in 2019, has reportedly served 1,500 clients during its four-year run. Three-hundred-fifty “graduated”, and seventy percent of those who remain are supposedly “on track”. Of the graduates, only five percent have again faced charges (so far). For drop-outs, recidivism stands at ten percent.
Nick Stewart-Oaten, the lawyer who authored the diversion law, feels that these are promising numbers. But how could it be otherwise? Given the rules on who can apply, judges’ stringent selection practices, and the considerable oversight that’s exercised over active clients, one should expect minimal recidivism. (That it’s somewhat higher for drop-outs makes perfect sense.) As things stand, mental health diversions are relatively few. In the real world, it could hardly be otherwise. A key issue that none of the content-rich websites and reports deems worthy to address – the views and feelings of the victims of violence – is undoubtedly a key obstacle. Imagine the political repercussions should a wealthy or politically-influential victim of violence discover that their assailant was “let go.”
Be sure to check out our homepage and sign up for our newsletter
And that brings us to our final point. Set aside the propaganda: unless diversions increase a hundred-fold, they can’t substantially reduce the number of “Fearful, Angry, Fuzzy-Headed and Armed” persons who enter the criminal justice system. For that, prevention is key. Giving mentally-disturbed, violence-inclined persons the equivalent of “rapid diversion” before they strike is the purpose of California’s spanking-new CARE Courts. To be launched this October in seven counties, it will focus on adults who suffer from schizophrenia and other psychoses. Referrals can come from a variety of sources, including families, first responders and social service agencies. Clients get public defenders, and judges can impose treatment plans that last up to two years. Medication can be refused, but failure to succeed can set off the existing, old-fashioned involuntary commitment process.
As one might expect, CARE’s compelled nature has drawn considerable blowback from civil libertarians. After all, de-institutionalization has been the watchword for decades. Yet, as we suggested in “Are We Helpless to Prevent Massacres?”, a land awash in AR-15’s and such might benefit from a bit of coercion. Sure enough, “Red Flag” laws sometimes get the gun. But underlying mental health issues often remain unaddressed.
Will CARE fill that gap? Ask us in a couple of years. Meanwhile, keep your head down!
UPDATES (scroll)
10/25/24 In 2018 New York State’s “Raise the Age” law forbid treating criminal defendants under 18 years of age as adults. Instead, even those charged with serious crimes were redirected to youth and Family courts and housed in youth facilities. Between 2018-2023 the number of murder defendants ages 16 and older who were confined in youth centers jumped from seven to 134. According to New York City investigators, changes in the nature of their clientele has badly upset the applecart at youth facilities and led to a surge of “assaults, threats and the discovery of weapons.”
10/21/24 According to NYPD, the number of persons under 18 committing major crimes has risen a steep 37 percent since 2017. Some blame it on a 2017 New York State law that diverted 16 and 17-year olds from adult to juvenile courts. As for country-wide numbers, the Council on Criminal Justice reports that overall crime by juveniles fell during 2016-2022. Murders committed by youths, though, increased a stunning 65%, while their use of guns to commit crimes went up by a lesser (but still substantial) 21%.
8/6/24 Five years ago L.A.-area justice reformers rejoiced over plans to drastically decrease the county jail population and ultimately close the facility. The money saved would fund alternatives to incarceration. But although the number of inmates has fallen, Sheriff Robert Luna recently warned that 75 percent of inmates face charges “too serious for diversion programs”. And while the State did lower penalties for thefts and drug crimes, voters will soon decide whether to return sanctions to their former levels.
7/12/24 Since 2015 sixteen cities and counties that form “a diverse cross-section of jails in the U.S.” have participated in CUNY’s Safety + Justice Challenge, which promotes reform-minded strategies to reduce incarceration. Its most recent report about arrests and rebookings of arrested persons, which includes data thru April 2023, reveals that “local violent crime rates varied regardless of changes to the jail population.” Only about two percent of releasees were rebooked for another violent crime, providing reassurance that “the pandemic-era increase in violent crime was not caused by jail reduction reforms.”
2/12/24 California’s new CARE Court allows individuals to seek judicial orders compelling severely distressed family members to undergo psychiatric examinations and, if necessary, submit to custodial or non-custodial treatment. But initial indications are not promising. A Los Angeles woman who is seeking to have her schizophrenic, drug-abusing estranged husband brought before a judge has experienced a more than two-month delay in finding out whether her petition was even accepted.
11/9/23 Two years ago progressive L.A.D.A. George Gason’s since-modified policy enabled 25-year old Hannah Tubbs to avoid being prosecuted as an adult for sexually assaulting a child in 2014, when she was seventeen. Tubbs later bragged about her lenient treatment. Now twenty-seven, she has pled guilty to voluntary manslaughter, robbery and witness intimidation for a 2019 killing, when she was indisputably an adult. Gascon now allows a panel to decide whether juveniles can be tried as adults.
10/3/23 California’s CARE Courts are now in operation. Designed as an alternative to old-fashioned institutionalization, its judges can order the examination of persons referred by first responders and family members because they seem likely to hurt themselves or others. Treatment programs can be imposed on persons suffering from schizophrenia and certain psychoses, and noncompliance can lead to institutionalization. But standards for compelled treatment are rigorous. According to one CARE Court judge, “it is probably not going to make a huge dent in what you observe in the community.”
6/6/23 A 31-year old San Jose, Calif. man with a “violent, delusional past” is in custody after an inexplicable series of attacks that left three persons dead and five injured. Kevin Parkourana, who was on felony probation and has a string of convictions and mental-health detentions, stole vehicles, stabbed drivers, and ran over pedestrians and a man on a scooter. Parkourana was most recently arrested in January for a knife attack but was not charged. Santa Clara Co. court history
5/30/23 A 20-year old Arizona man faces four counts of murder and one of attempted murder after confessing that he engaged in a Phoenix-area killing spree that left four persons dead and one wounded. Iren Byers told Mesa police that he was motivated by a hatred for drugs, and that his middle-aged victims, allegedly street persons who used fentanyl and other narcotics, “didn't deserve” help. Officers found the 9mm. pistol that Byers used in his grandmother's bedroom.
|
Did you enjoy this post? Be sure to explore the homepage and topical index!
Home Top Permalink Print/Save Feedback
RELATED POSTS
Police and the Mentally Ill special topic
A Broken System Fearful, Angry, Fuzzy-Headed. And Armed.
Are We Helpless to Prevent Massacres? Red Flag (I) (II) A Stitch in Time Letting Go
Posted 3/20/23 (edited 6/7/25)
A BROKEN “SYSTEM”
Exploiting yet another break, a parolee absconds.
He wounds three police officers, and society shrugs.
For Police Issues by Julius (Jay) Wachtel. We’re not privy to juvenile records. So all we can say is that the first significant criminal action against Jonathan Magana took place just a few months after his eighteenth birthday, when the Los Angeles resident was arrested for armed robbery. Two months later, after pleading “nolo” to a felony, the young adult drew a year in county jail and five years’ probation. As a felon, he became forbidden from ever having guns or ammunition.
Alas, Mr. Magana’s first adult brush with the law apparently had little effect. Our search of L.A. County Superior Court records reveals that he enjoyed quite the criminal career. Here are his known arrests (most recent first):
- 10/5/22: Battery on a peace officer, felon with a firearm and parole violation. Posted bail. On 2/2/23 warrants were issued for failure to appear.
- 10/27/19: Armed robbery (two counts) and attempted robbery. Pled guilty on 2/4/20, sentenced to four years imprisonment.
- 9/14/14: Possession of controlled substance. Pled guilty on 4/2/15, got 40 days in jail.
- 8/31/13: Felon with a firearm. Pled nolo on 2/28/14, drew one year county jail, three years probation.
- 5/1/11: Felon with ammunition. Pled guilty on 5/11/11, got 32 months prison.
- 12/17/09: Hit and run, no driver liccense. Pled nolo on 10/25/10, got probation.
- 2/6/09: Armed robbery. Pled nolo on 4/28/09, got one year county jail, five years probation.
Click here for the complete collection of crime & punishment essays
Except for a gap following his 2014 arrest, Mr. Magana was always convicted on new charges well before his existing sentence would have expired. Yet punishment-wise, Mr. Magana always got a break. In December 2009, less than eight months after drawing a year for armed robbery, Mr. Magana was arrested for hit-and-run and unlicensed driving. He got a slap on the wrist. In August 2013, less than twenty-eight months after getting thirty-two months for having ammunition, Mr. Magana was caught with a gun. That earned him county jail time and probation. And most recently, in October 2022, thirty-two months after being sentenced to two prison terms for two robberies – one for four-years, another for one year – Mr. Magana was again caught with a gun. He also battered a cop.
Mr. Magana faced a parole violation. Yet he was nonetheless allowed to post bail. And as one might have expected, he flew the coop. Five weeks later, on March 8, LAPD officers spotted the fugitive. He ducked into a residence. Police ordered him to come out, but he refused. So a K-9 team went in. Mr. Magana responded with gunfire. Three officers were wounded, fortunately none critically.
SWAT took over and sent in a robot. Mr. Magana’s body was hauled out later that night. He had committed suicide.
“Three officers shot” dominated the broadcast news. But when we turned to our main go-to source for happenings in Southern California, the Los Angeles Times, their coverage seemed to lack its usual depth. Click here for the first piece, and here for the second. Three days after the shooting, its weekly “The Week in Photos” feature was prominently tagged “A brutal killing devastates a family; meanwhile, California braces for flooding”. That “family” was unrelated to the officers’ shooting. As for the cops, their tragedy was accorded one measly picture, and it could only be reached after considerable scrolling. It depicts a patrol officer placing a flare on the roadway.
Fortunately, other news outlets proved quite informative. A detailed account by the Associated Press featured some telling comments from the board of the L.A. police officers’ union:
Although we believe they will recover physically, each of these officers will live with the memory of almost losing their lives at the hands of a wanted fugitive in a hail of gunfire. What occurred last night to these Metropolitan Division K-9 officers happens all too often to law enforcement officers and is a stark reminder of the inherent danger every officer faces when they put on their uniform each day.
KTLA, a local television station, posted a print version of its comprehensive on-air coverage. After exploring Mr. Magana’s criminal past and the breaks he got in some detail, it conveyed the heartfelt comments of L.A. Mayor Karen Bass, who spoke with two of the officers in the hospital:
I think that it was just important for me to be here. This is a place that is familiar to me. I used to work here in the emergency room, in trauma, and so to go back to the emergency room now to try to bring comfort and support to officers was something that was very important and meaningful to me…It is worth repeating that we must do much, much more to protect our officers and protect our communities.
To be fair, the Times did (briefly) allude to Mr. Magana’s criminal career. But its coverage was far less informative than what we found elsewhere. Say, in the Washington Times. Its detailed account was descriptively entitled “Another felon released early from prison shot three police officers in Los Angeles.”
Alas, many such encounters have produced tragically lethal endings. Here are four recent Southern California examples (see updates to “Catch and Release”):

- On June 14, 2022, a multi-convicted felon shot and killed El Monte, Calif. police officers Michael Paredes and Joseph Santana as they responded to a domestic violence call. Justin Flores wouldn’t have been running loose had progressive L.A. District Attorney George Gascon not barred his deputies from using sentencing enhancements. Instead, the known gang member was back on the streets after serving twenty days for felon with a gun.
- On December 1, 2022 a multi-convicted felon shot and killed Riverside County (Calif.) Deputy Isaiah Cordero during a traffic stop. Two months earlier William Shea McKay was convicted of crimes including false imprisonment and evading police. But a judge released him on bail and repeatedly postponed sentencing. Police later shot McKay dead. To the Times’ credit, it published a piece that deeply probed McKay’s criminal past. It was entitled “Why a three-strikes felon — on bail twice over — was on the streets, where he gunned down a deputy.”
- On January 31, 2023 a 23-year old ex-con shot and killed Selma, California police officer Gonzalo Carrasco Jr. Officer Carrasco, who had two years on the job, encountered Nathaniel Dixon on a suspicious person call. Dixon had served a brief prison term for robbery. Once released he accumulated a series of gun and drug convictions. But thanks to a considerate plea deal and California’s “Public Safety Realignment Act” (see below) he was on probation.
“Cause and Effect” traced California’s easing of punishment to September 2010, when then-Governor Schwarzenegger signed a bill raising the threshold for felony Grand Theft from $400 to $950. One year later came the “Public Safety Realignment Act”, which redirected “non-serious, non-violent” offenders from state prison to county jail. In 2014 Proposition 47 reclassified all thefts where losses don’t exceed $950 (including break-ins formerly treated as burglaries) to misdemeanors. Two years later came the alluringly entitled “Public Safety and Rehabilitation Act”, which directed that persons convicted of non-violent crimes be paroled after completing their primary term, regardless of other charges or sentence enhancements. And in 2022, AB 2361 forbid transferring minors to adult court without proof that they couldn’t be rehabilitated if treated as juveniles.
Progressive places are likely to “realign” until the proverbial cows come home. But coupling high-sounding concepts such as “realignment” and “rehabilitation” with “public safety” overlooks a chronic problem. According to a September 2021 BJS report, “Recidivism of Prisoners Released in 24 States in 2008”, 81.9 percent of the members of this population of releasees was rearrested within ten years; 39.6 percent for a violent crime and 47.4 percent for a property crime (Table 11). And when rearrested, those who had been imprisoned for a violent crime were somewhat more likely than property offenders to be charged with a violent offense (44.2% v. 39.7%).
What’s more, the length of prison terms proved important (Table 14). Inmates who served sentences longer than the median (15 months) were less likely to be rearrested within ten years (75.5% v. 81.1%). That was particularly so for those who had been convicted of a violent crime. For this group, 78.3 percent who served terms less than the 29-month median were arrested within ten years of release. That dropped to 66.4 percent for inmates whose sentences had exceeded the median, a statistically significant difference.
Still, as in virtually every other aspect of public policy, ideology rules. One day before Mr. Magana wounded the three officers, the Los Angeles city council put off a decision on whether to accept a $280,000 gift to acquire an advanced robotic dog. Although its donor, the LAPD Foundation, assured lawmakers that the newfangled creature “would allow authorities to avoid unnecessarily putting officers in harm’s way and potentially avoid violent encounters,” protesters argued that its true purpose was to help cops spy on minorities.
Your blogger is no fan of harsh policing. Nor of harsh punishment (see, for example, “Tookie’s Fate” and “Lock’Em Up”). But what he learned during a law enforcement career makes him reluctant to endorse get-out-of-jail-free cards. As the BJS report mentioned on its very first page, “about 61% of prisoners released in 2008 returned to prison within 10 years for a parole or probation violation or a new sentence.” Still, convicted persons can’t be locked up forever. While officers Paredes, Santana, Cordero and Carrasco would have certainly benefited had their assailants remained in custody, long prison terms provoke liberty concerns and are very expensive. At some point inmates must be let go.
Be sure to check out our homepage and sign up for our newsletter
So what could help? Progressively-minded California has a couple of intriguing approaches. At the state prison in Lancaster, an “Offender Mentor Certification Program” trains prisoners as alcohol and drug addiction counselors. Its intense eighteen-month program, which includes an lengthy, hands-on internship, has enabled many former inmates to secure related positions after release. And in a brand-new effort, Governor Gavin Newsom announced a re-do of infamous San Quentin prison – California’s oldest lockup and the home of its only death row (he halted its use in 2019). Based on a Scandinavian model, the “Big Q” will focus on rehabilitation, education and training. California’s re-do (it’s already in place at SCI Chester, a Pennsylvania prison) has drawn interest from across the U.S.
Yet for now, when it comes to punishment, the criminal justice “system” is clearly broken. Whether their disputes reflect differences in ideology or perspective, judges, prosecutors, cops and corrections officials can’t seem to agree on basics such as length of confinement, terms of release, and what to do when efforts to give someone a “break” don’t work. And it’s not just cops who suffer the consequences. So until “Little Scandinavia” (that’s what they call SCI Chester) becomes a universal reality, perhaps we ought to encourage everyone who participates in that imperfect “system” to take a deep read of that sobering BJS report.
It couldn’t hurt.
UPDATES (scroll)
6/18/25 Birmingham, AL man Damien McDaniel, 22, faces capital murder charges for allegedly gunning down eighteen persons in 2023 and 2024. He allegedly murdered eleven patrons and wounded twenty-nine during a three-month span last year. That includes mass shootings at two nightclubs: one in July, which killed four patrons and wounded ten, and another in September, which killed four and wounded seventeen. He is also charged with committing single fatal shootings on each of three days last August and September. McDaniel apparently had seven other victims in 2023. His trials will begin next year. But with all the publicity, finding “fair juries” won’t be simple.
6/11/25 A Washington Post investigation reveals that D.C. youths arrested for even the most serious crimes are routinely released on ankle monitors, which they are responsible for keeping charged. Some kids told reporters that they don’t bother to keep the devices working; one admitted that he committed robberies while supposedly being “tracked.” And even when teens get hauled in for failing to comply, judges simply release them again. Experts criticize the devices, as there is no evidence that they deter misbehavior or help young persons heal. “A monitor is just a black box. It
doesn’t educate young people, it doesn’t rehabilitate them, it’s not a substitute for going to school or getting counseling...”
6/10/25 Last October a 15-year old D.C. youth and a 17-year old companion violently robbed a 39-year old man. Their victim wound up in a coma and passed away in two weeks. At the time the 15-year old had five open robbery and assault cases. But he was nonetheless released. Now 16, he just pled guilty to murder in juvenile court. His maximum sentence is detention until he turns 21. Bryan Smith’s friends were dismayed; the judge conceded that their criticism “was not unreasonable.”
6/9/25 “Operation Justice Trail,” an initiative of Dallas police chief Daniel Comeaux, draws on the resources of his agency and the U.S. Marshals Service to arrest the city’s “most wanted criminals.” In its first month the project has arrested 98 persons wanted for violent crimes. These offenders had amassed a startling 700 convictions. Problem is, criminals often go on the lam after bonding out. Keeping that from happening may not be easy. According to the D.A., “...the way the system is set up in Dallas County, we’re not even present when the initial bonds are set.” Information that leads to the arrest of a wanted violent felon can earn a tipster up to $5,000.
5/22/25 After fleeing from a Pennsylvania youth detention center, where they were being held on behalf of D.C. authorities, three teens, ages 15, 17 and 18 stole an SUV and headed home. Meeting up with a couple of other young evildoers, they used an AR-15 rifle to commit a robbery, wounding the victim. Daijon Bourn, 17, who had pled guilty in a 2022 killing, and 18-year old Javontay D. Johnson, who was convicted of assault with a dangerous weapon, have been recaptured. Still on the lam is the 15-year old, who was convicted of robbery.
5/21/25 Ten inmates of a New Orleans jail slithered out by shoving aside a toilet that covered an existing hole in the wall. Their
efforts were aided by a maintenance worker who insists he only helped out because he would have otherwise been “shanked.” Sterling Williams, 33, has
been charged with 10 counts of escape, and one of malfeasance. So far, four escapees have been caught. They, and those still on the lam, were awaiting trial or
sentencing on charges ranging up to murder. “There are witnesses and victims, and all of those people are very, rightfully, unnerved by all of this,”
said Louisiana’s A.G.
5/14/25 Despite vigorous opposition from the current D.A., L.A. Superior Court judge Michael Jesic went along with the previous D.A.’s request and resentenced Eric and Lyle Menendez, who were doing life without parole for murdering their parents, to fifty years to life. Since the brothers have served 35 years and were under 26 when they committed the murders, they are eligible for parole. That’s a time-consuming process. Governor Newsom could also invoke clemency, and a hearing is scheduled in June. (See 2/4/25 update)
5/2/25 On May 21, 2024 the L.A. Sheriff’s Dept. gave the D.A.’s office a report alleging that Mario Edgardo Garcia-Aquino, a 43-year-old youth soccer coach, sexually assaulted one of his players. But due to a case “backup” the D.A. didn’t issue a warrant for Garcia-Aquino until April 2, 2025, when the body of another of Garcia-Aquino’s soccer players was discovered in a ditch. He’s been charged with the killing, and with two instances of sexually abusing teens. According to the D.A., a new rule requires that sex abuse charges be promptly filed. And according to DHS, Garcia-Aquino is illegally present in the U.S.
California prisons had 24 inmate-on-imate killings in 2024. So far this year there’s been thirteen. Most recently, the killing of convicted rapist Renee A. Rodriguez by Kenneth Wilson, who is doing life without parole for 1st. degree murder. Other recent prison killings include the slaying of prisoner William Couste by inmate Rodger Brown, who is doing life for a previous inmate killing. And another prisoner reportedly told his psychologist that murdering his cellmate “was a ‘freebie’ because he was already serving life.” California’s long-standing death penalty moratorium was imposed by Governor Gavin A. Newsom in March, 2019.
4/28/25 “Thousands” of California prison inmates have gone through a decade-old reentry program that transfers them to local facilities as they approach their release date. Its purpose, to help them re-integrate into society, has reportedly met wide success, and an expansion is in the works. But so far this year “at least” nine participants slipped off their ankle monitors and walked away. These include three convicted robbers: Dijon Barber and Deshon Daniels, who were both re-captured, and Jose Arroyo, who remains at large.
3/31/25 Conjugal visits at Northern California’s Mule Creek State Prison take place in “apartment-like facilities” and “are intended to foster family copnnections.” But two such overnight visits last year ended with the violent deaths of visiting spouses. Their alleged killers were David Brinson, 54, who was serving consecutive life terms for murdering four men during a 1990 robbery, and Anthony Curry, who drew 30 years to life for shooting and blinding a woman with whom he was having an affair. But his first love forgave him and visited. Curry has been charged with murder; Brinson is yet to be charged.
3/21/25 David Brinson, 54 murdered four men during a 1990 robbery. He drew four consecutive life terms at a California prison. Last November he and his 62-year old wife had a private overnight “family visit” in an apartment-like facility on prison grounds. According to authorities “these visits are designed to support positive family connections and successful rehabilitation.” About 2:00 a.m. Brinson notified prison staff that his wife had “passed out.” But an autopsy found that she was strangled to death.
3/13/25 Inmate-on-inmate killings beset California prisons. A recent “surge” - there were seven such episodes during the first nine weeks of 2025 - has led to severe restrictions on prisoner movement and visitations. Some “lifers” seemingly feel immune to sanctions. A prisoner was murdered in January by two “lifers,” each of whom had previously killed a fellow inmate. One had told a prison psychologist that given his existing life term, that attack, in which he “strangled, beat and slashed his cellmate,” was in effect a “freebie.”
3/12/25 Two D.C. teens, now ages 16 and 17, face murder charges for the brutal robbery and beating of a 39-year old man last October. At the time, the 16-year old had six “active” robbery/assault cases pending, while the 17-year old was on probation for an undisclosed offense. Police said the pair had been involved in three other assaults and robberies on that day as well. They will now remain in custody.
3/11/25 Shortly after leaving the Chicago courthouse where he was pending trial on gun charges, Eric Vaughn, 28, was ambushed and slain. His alleged killer, Marquez Robinson, 25, is on Federal parole for a drug conviction. However, his parole has been in question because of a
recent arrest for burglary. And while he’s yet to be charged with murder, Robinson is back in Federal custody facing ex-con with a gun charges in connection
with Vaughn’s killing.
2/4/25 Former L.A. County D.A. George Gascon’s progressive, go-easy approach led voters to replace him with Nathan Hochman. Gascon had endorsed resentencing the Menendez brothers to straight life terms, which could lead to their parole. His prosecutors on that motion, Brock Lunsford and Nancy Theberge, remained on staff. They are now suing current D.A. Hochman for defaming them and reassigning them to lesser roles. Like retaliation claims were once made against Gascon by prosecutors who said they were punished for opposing his progressive policies. (See 5/14/25 update)
1/13/25 On January 9, as major blazes beset Southern California, residents of an L.A.-city neighborhood that was being consumed by flames alerted police about a man who was trying to set brush on fire. LAPD officers detained Juan Sierra, 33, and arrested him for violating his probation on a 2023 assault conviction. Sierra, who reportedly has a substantial arrest record, has been identified by Ventura County authorities as “a person of interest” in the Kenneth fire, which has destroyed over 1,000 acres.
1/13/25 In December 2016 North Carolina man Edgar Welch, then 24, acted out his beliefs in the “Pizzagate” internet conspiracy by opening fire with an AR-15 rifle in a Washington, D.C. pizza parlor. Fortunately, no one was hurt, and Welch surrendered to police. He pled guilty to Federal firearms charges and served four years. Welch was released in May, 2020. On January 4, 2025, Welch pulled a gun on North Carolina officers who were trying to arrest him for a probation violation. He was shot dead.
1/3/25 In 2012 San Diego, Calif. resident Mary Shojai declined Paul Carl Tomasini’s marriage proposal. So he violently assaulted her, repeatedly striking the 66-year old woman with a mallet until she was dead. Tomasini, who seemed deeply remorseful, was convicted of murder and drew life. But in 2022 California AB 960 provided for compassionate release. That law was recently applied to Tomasini, who developed terminal cancer while imprisoned. He’s been released to a “healthcare facility.” And Shojai’s daughter is incensed. His release, she says, has driven her family into “a state of hellish angst.”
1/2/25 Information from a citizen that a Virginia home was chock-full of weapons and explosives recently led to the arrest of 35-year old Brad Spafford, who resides there with his wife and two children. Although Federal agents said they found more than 150 pipe bombs and other explosive devices, Spafford has so far only been charged with having an unregistered short-barreled rifle. A Federal magistrate just recommended that Spafford, who reportedly lacks any criminal record, be released to his mother, but agreed to temporarily jail him while the Government makes a case for his detention.
Keep going...
|
Did you enjoy this post? Be sure to explore the homepage and topical index!
Home Top Permalink Print/Save Feedback
RELATED POSTS
Bail and Sentence Reform topic
A Money Pit Citizen Misbehavior Breeds Voter Discontent Switching Sides
Is Diversion the Answer? Cause and Effect Must the Door Revolve? Catch and Release
Tookie’s Fate is the Wrong Debate Lock ‘Em Up (and Send the Bill to Venezuela)
|